2.3 Candlestick Patterns

Welcome to this lesson on candlestick patterns! Candlestick patterns are an essential aspect of technical analysis, providing visual representations of price action in the market. They can help you identify potential entry and exit points, as well as provide insight into market sentiment.
Candlesticks are composed of four components: the open, high, low, and close prices. The body of the candlestick represents the difference between the open and close prices, while the wicks (or shadows) extend from the body to the high and low prices of the period.
In this lesson, we'll cover some of the most common candlestick patterns and their potential implications for your trading decisions:
Single candlestick patterns:
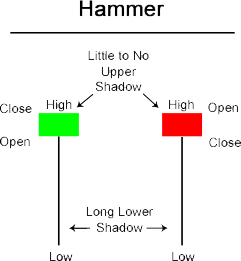
Hammer: A bullish reversal pattern characterized by a long lower wick and a small body at the top of the range. It indicates that the market rejected lower prices and closed near the high, suggesting a potential reversal from a downtrend.
Inverted Hammer: Similar to the Hammer, but with a long upper wick, indicating potential bullish reversal after a downtrend.

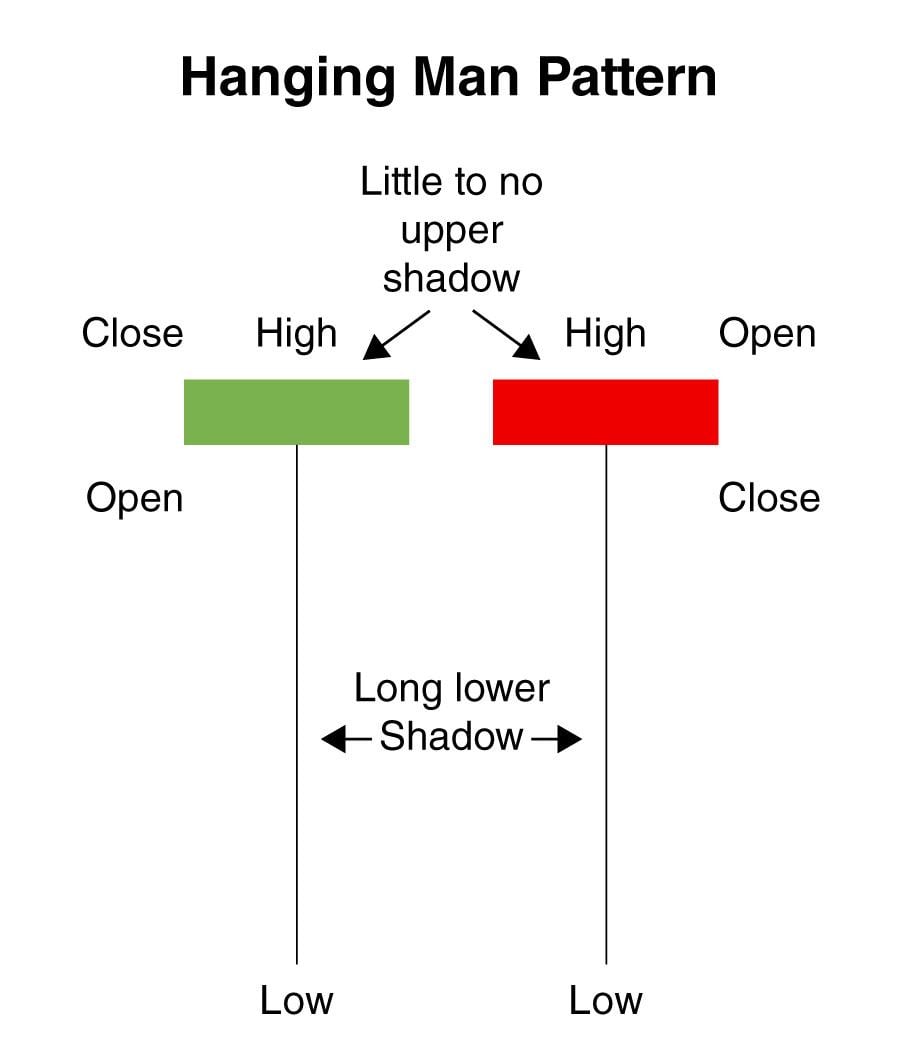
Hanging Man: A bearish reversal pattern that looks like a Hammer but occurs at the end of an uptrend, signaling that the market might be topping out.
Shooting Star: Similar to the Inverted Hammer, but occurs at the end of an uptrend, suggesting a potential bearish reversal.
Double candlestick patterns:
Bullish Engulfing: A bullish reversal pattern where a small bearish candle is followed by a larger bullish candle that engulfs the previous candle's body. It indicates that buying pressure is overtaking selling pressure.

Bearish Engulfing: A bearish reversal pattern that occurs when a small bullish candle is followed by a larger bearish candle that engulfs the previous candle's body, signaling a potential shift from buying to selling pressure.

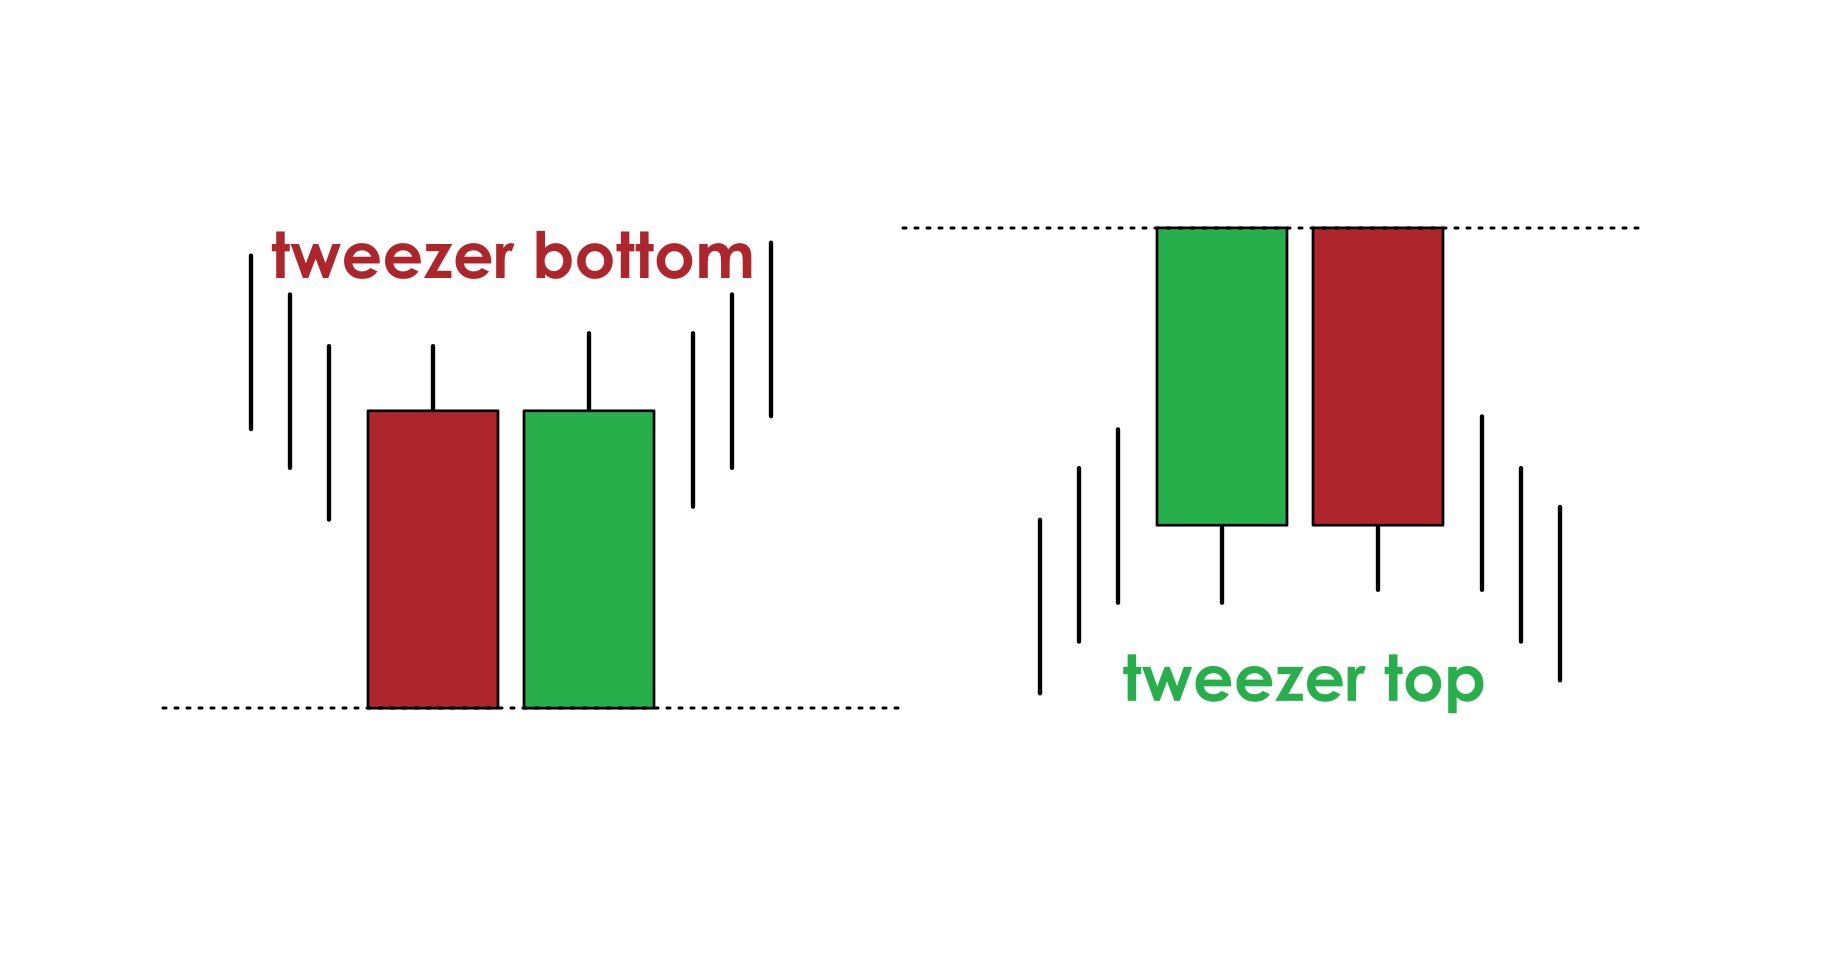
Tweezers: A potential reversal pattern that occurs when two consecutive candles have equal high or low points, suggesting indecision in the market.
Triple candlestick patterns:
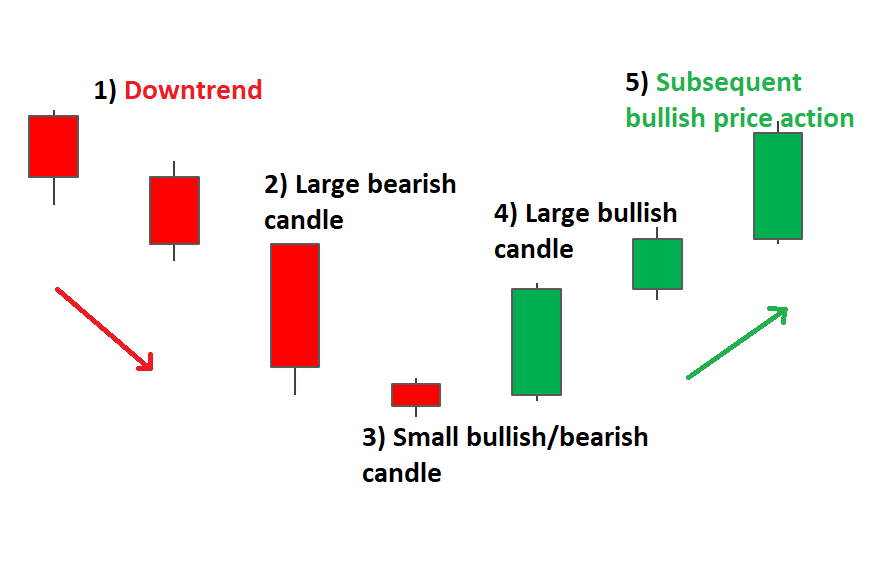
Morning Star: A bullish reversal pattern consisting of a long bearish candle, followed by a small-bodied candle, and then a long bullish candle. It indicates a potential shift from selling to buying pressure.
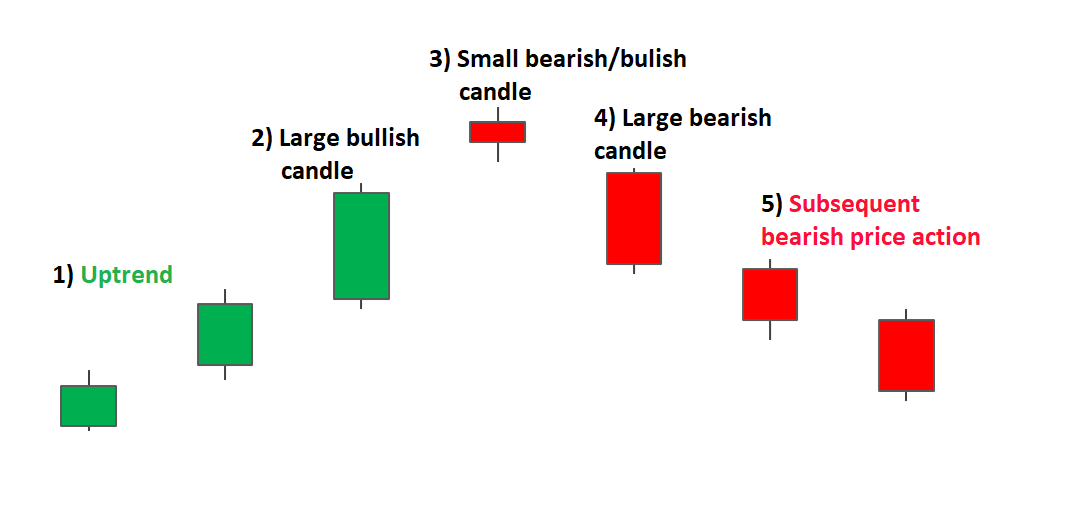
Evening Star: A bearish reversal pattern consisting of a long bullish candle, followed by a small-bodied candle, and then a long bearish candle. It suggests a potential shift from buying to selling pressure.
Three White Soldiers: A bullish continuation pattern characterized by three consecutive long bullish candles, signaling strong buying pressure.

Remember, candlestick patterns should not be used in isolation. Always combine them with other technical analysis tools and confirm the signals they provide before making trading decisions.